My approach to both of these speaking opportunities was to show how accessible this space is to new comers and break down the jargon.
- First, analytics is a creative space that needs people with new ideas that will challenge the status quo.
- Second, it’s a fairly new field which means we’re ALL still learning.
- Third (speaking of learning), the field is constantly evolving and those coming into the space today bring new research and techniques to the table.
With that, welcome to the field of data analytics!
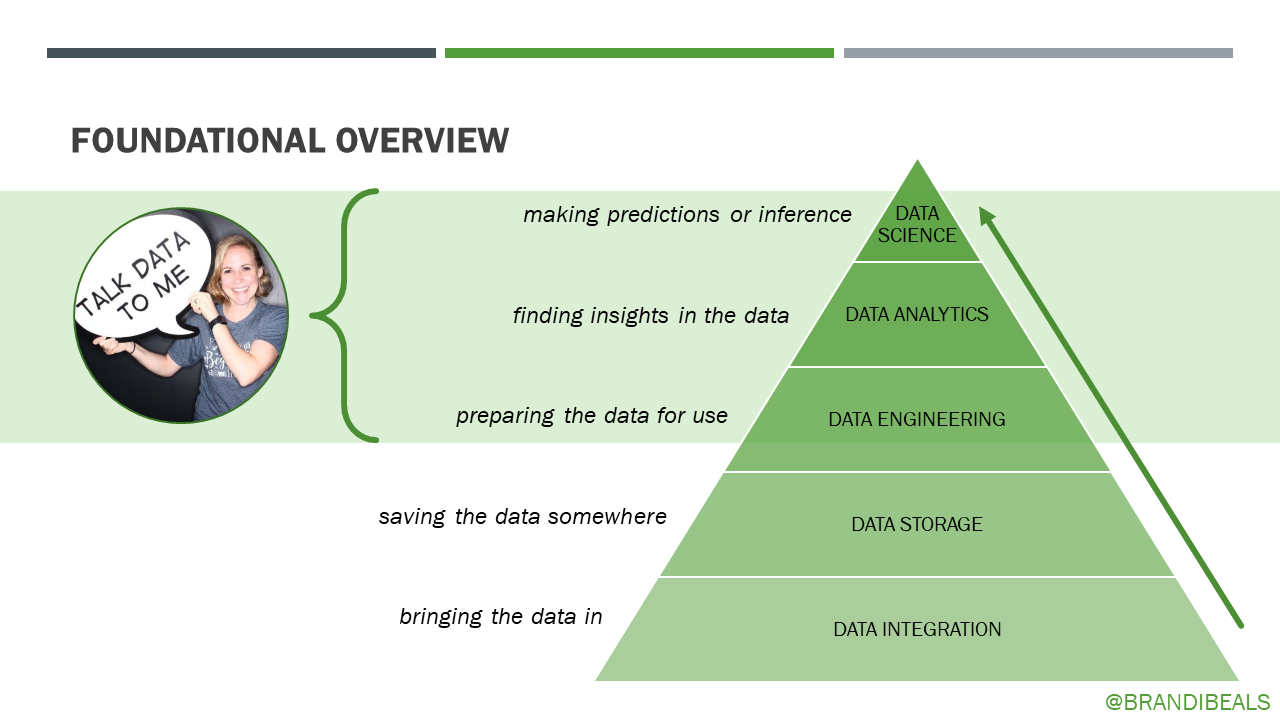
I started my first Saturday of presentations with an overview of the tech stack associated with data analysis work. Analytics and data science sit atop systems like databases and tools that suck data in and make some initial order of it.
Then I went on to explain and discuss some of the most popular tools in each space (thanks to Gartner's Magic Quadrant) while being really clear that my area of expertise is at the top of the pyramid.
After this overview, you might think it would be time to jump into analytics, but as an analytics professional I've found data engineering skills (even a light amount) exponentially increases your analytical capabilities.
So I had a second presentation about data engineering basics and we went through a hands-on example using beer data (such a Wisconsin thing to do). We actually just used Tableau Public (which is the free version of Tableau Desktop) because, surprisingly, there is actually quite a lot you can do with the most basic capabilities. I tried to cover the basic concepts in a short amount of time for a few reasons:- You learn by doing, so get your hands dirty
- Concepts help you understand how data is stored and brought together
- But you don't know what you need to know until you're faced with a problem
So bring on the problems!
Over the next weekend we got to the good stuff — visualization — the wow factor stuff.
A great example of the power of data visualization is showing how much easier it is to see patterns when data is formatted in a visual way. Another great example is more data science-y: Anscombe's Quartet. The idea here is that descriptive statistics (mean, median, and correlation) would all come back as the same values for each of these four data sets. The power of visualization allows you to see the differences that exist.Hopefully this brief overview was helpful. I could certain dive deeper into each one, but the idea here was to show that most data concepts are quite easy. And any jargon that used is simply a shorter way to say something quite simple. I know I didn't go over those phrases exactly, but you can find them in my slide decks (linked below). Perhaps I'll do a deep dive on each of these concepts over my next few posts. Stay tuned!
Final thoughts:
- No one knows everything. There are things I still struggle with when it comes to Tableau. Together, though, we know a whole heck of a lot. So lean on your team members and local user group communities, as they will lean on you. It’s okay to not know something, but having good systems to find the answers is crucial.
- Failing is part of the gig. So often I see non-technical folks get frustrated at not knowing something or struggling to find the answer to a problem. That is completely normal and you should be more concerned if something works out perfectly.
- You can find my presentations on the Background section of my website.


